Alright, buckle up buttercups! We're about to dive into the wildly exciting world of... drumroll please... linear correlation coefficient! And guess what? We're going to conquer it with the super-powered statistical sidekick that is StatCrunch.
Think of the linear correlation coefficient as a nosy neighbor. It wants to know if two things are gossiping together. Specifically, if they're moving in sync, like two synchronized swimmers (except with numbers, obviously).
First, fire up StatCrunch! It's like your trusty DeLorean, ready to take you on a statistical adventure. Now, you gotta feed the beast. I mean, the software.
Time to get your data in. Imagine you're trying to figure out if the amount of ice cream you eat correlates with your happiness level. You have two columns of numbers - "Ice Cream Scoops" and "Happiness Points." You can manually type them in, or copy-paste if you're feeling fancy! It's really up to you.
Let the Crunching Begin!
Now, the moment of truth! Click on "Stat" at the top of the screen. It's like choosing your superpower from a menu.
Then, hover your mouse over "Regression," because finding the correlation coefficient is really just a baby step towards a full-blown regression analysis! Think of it as dipping your toes into the statistical ocean.
From the "Regression" menu, select "Simple Linear." Boom! This is where the magic happens. A window pops up, ready for your instructions.
Tell StatCrunch What's What
In the window, you'll see a section labeled "X variable." This is your independent variable, the "cause" in your hypothetical cause-and-effect relationship. So, click on your "Ice Cream Scoops" column.
Next, you'll see "Y variable." This is your dependent variable, the "effect." Click on your "Happiness Points" column. You're telling StatCrunch, "Hey, see if these two are related!"
Now, scroll down, my friend, scroll down! You'll find a bunch of options, but don't let them scare you. We're not playing with those today.
See that beautiful "Compute!" button? Go for it! Click it like you're winning a prize (because, in a way, you are!).
Behold! The Correlation Coefficient!
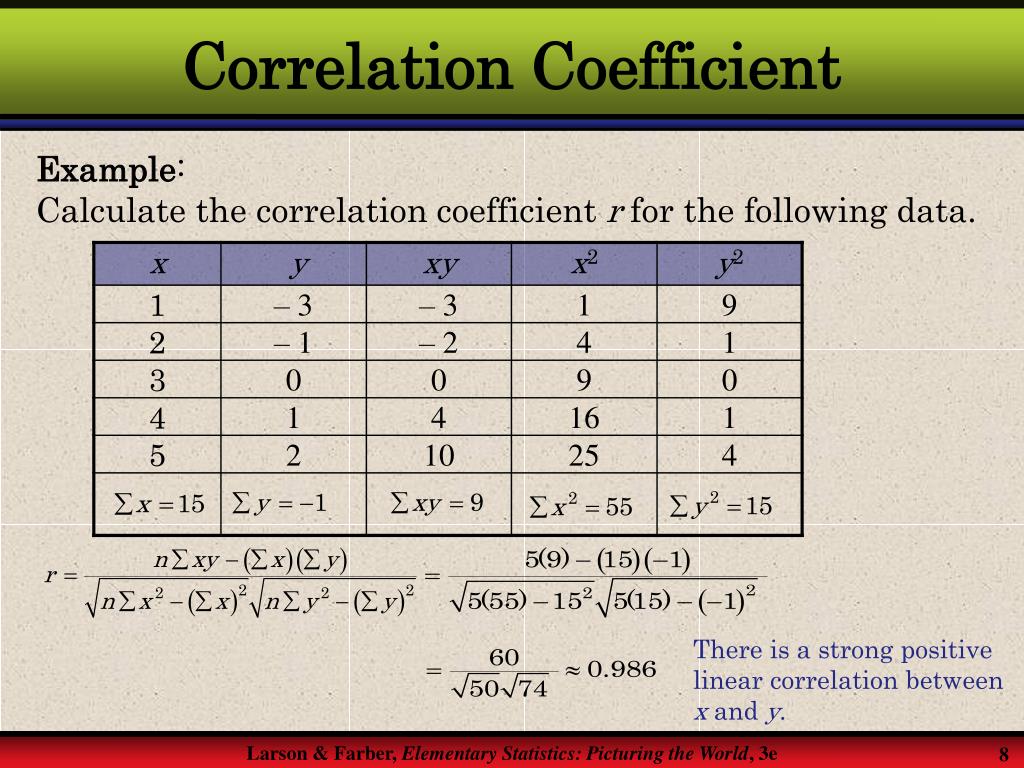
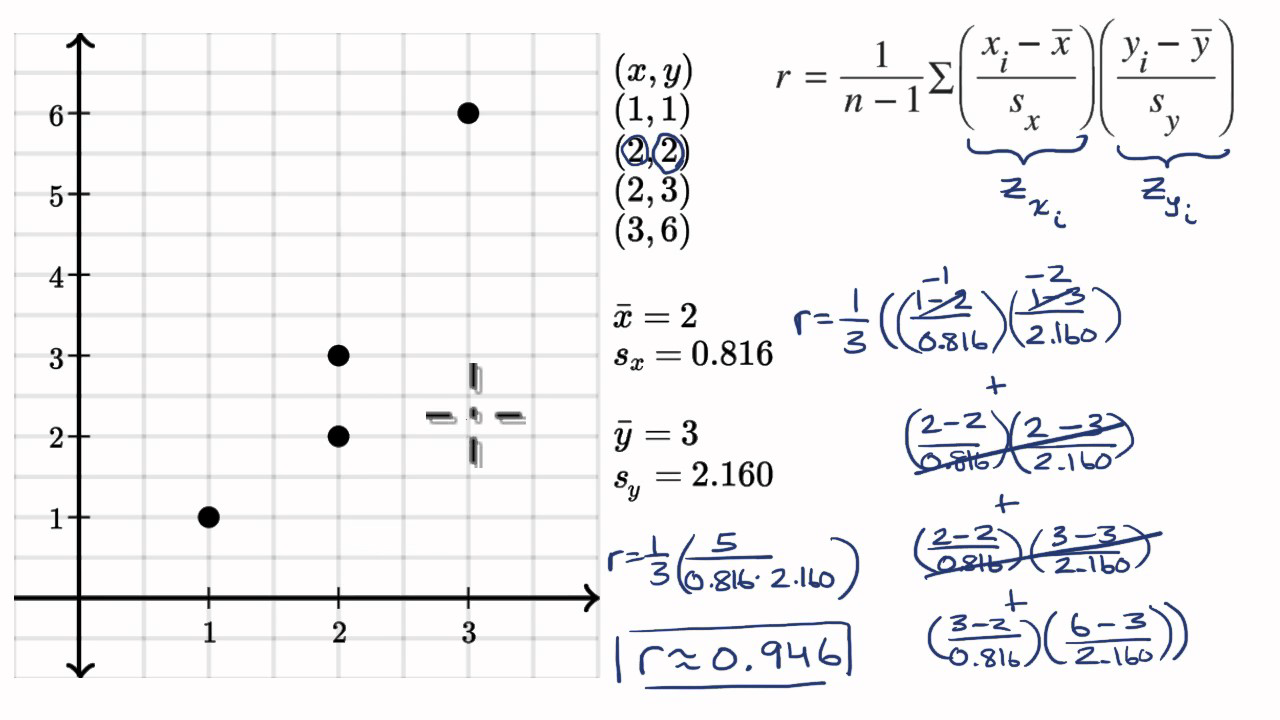
A new window pops up, filled with numbers and charts. Don't panic! We're only interested in one thing: the correlation coefficient. Look for "r = " followed by a number. It's usually somewhere near the top.
That "r" value is your linear correlation coefficient! It's a number between -1 and 1 that tells you how strongly the two variables are related. If it's close to 1, it's a strong positive correlation (more ice cream = more happiness!). If it's close to -1, it's a strong negative correlation (more ice cream = less happiness... whoa, that's a crisis!). If it's close to 0, there's practically no linear relationship at all.
So, there you have it! You've successfully found the linear correlation coefficient using StatCrunch. Now you can go forth and explore the relationships between everything!
Just remember, correlation doesn't equal causation. Just because ice cream and happiness are correlated doesn't mean one causes the other. Maybe happy people just tend to eat more ice cream!
Go forth and crunch, my friend! The world of statistical analysis awaits!


